1 · v0.1 · draft · 2026-08-08
| Doctype | Test Report |
|---|---|
| Product line | openvvvf |
| Applies to | openvvvf-control-module, chassis-size-2 |
| Version | 0.1 |
| Date | 2026-08-08 |
| Status | draft |
| Description | Validation of the inverter motor-resistance calibration routine against a bench LCR reference. |
| Test id | 1 |
| Nav order | 343 |
| Normative refs | OV-TEST-HW-MOTOR-CAL-INDEX, OV-TEST-HW-INDEX |
PMSM Resistance Calibration Validation
This report validates the inverter's cal Motor.Resistance routine by comparing its estimate against a direct bench LCR measurement of the test motor. The test was run on the C2 chassis test fixture, but the routine itself is shared across all OpenVVVF chassis; motor-specific validation is only needed when a different motor or harness is used.
Inductance reference measurements are kept in the PMSM Inductance Calibration Validation report.
A separate high-resistance load sanity check is documented in Power Resistor Sanity Check. A separate induction-machine test report is in Induction Motor Testbed.
Test setup
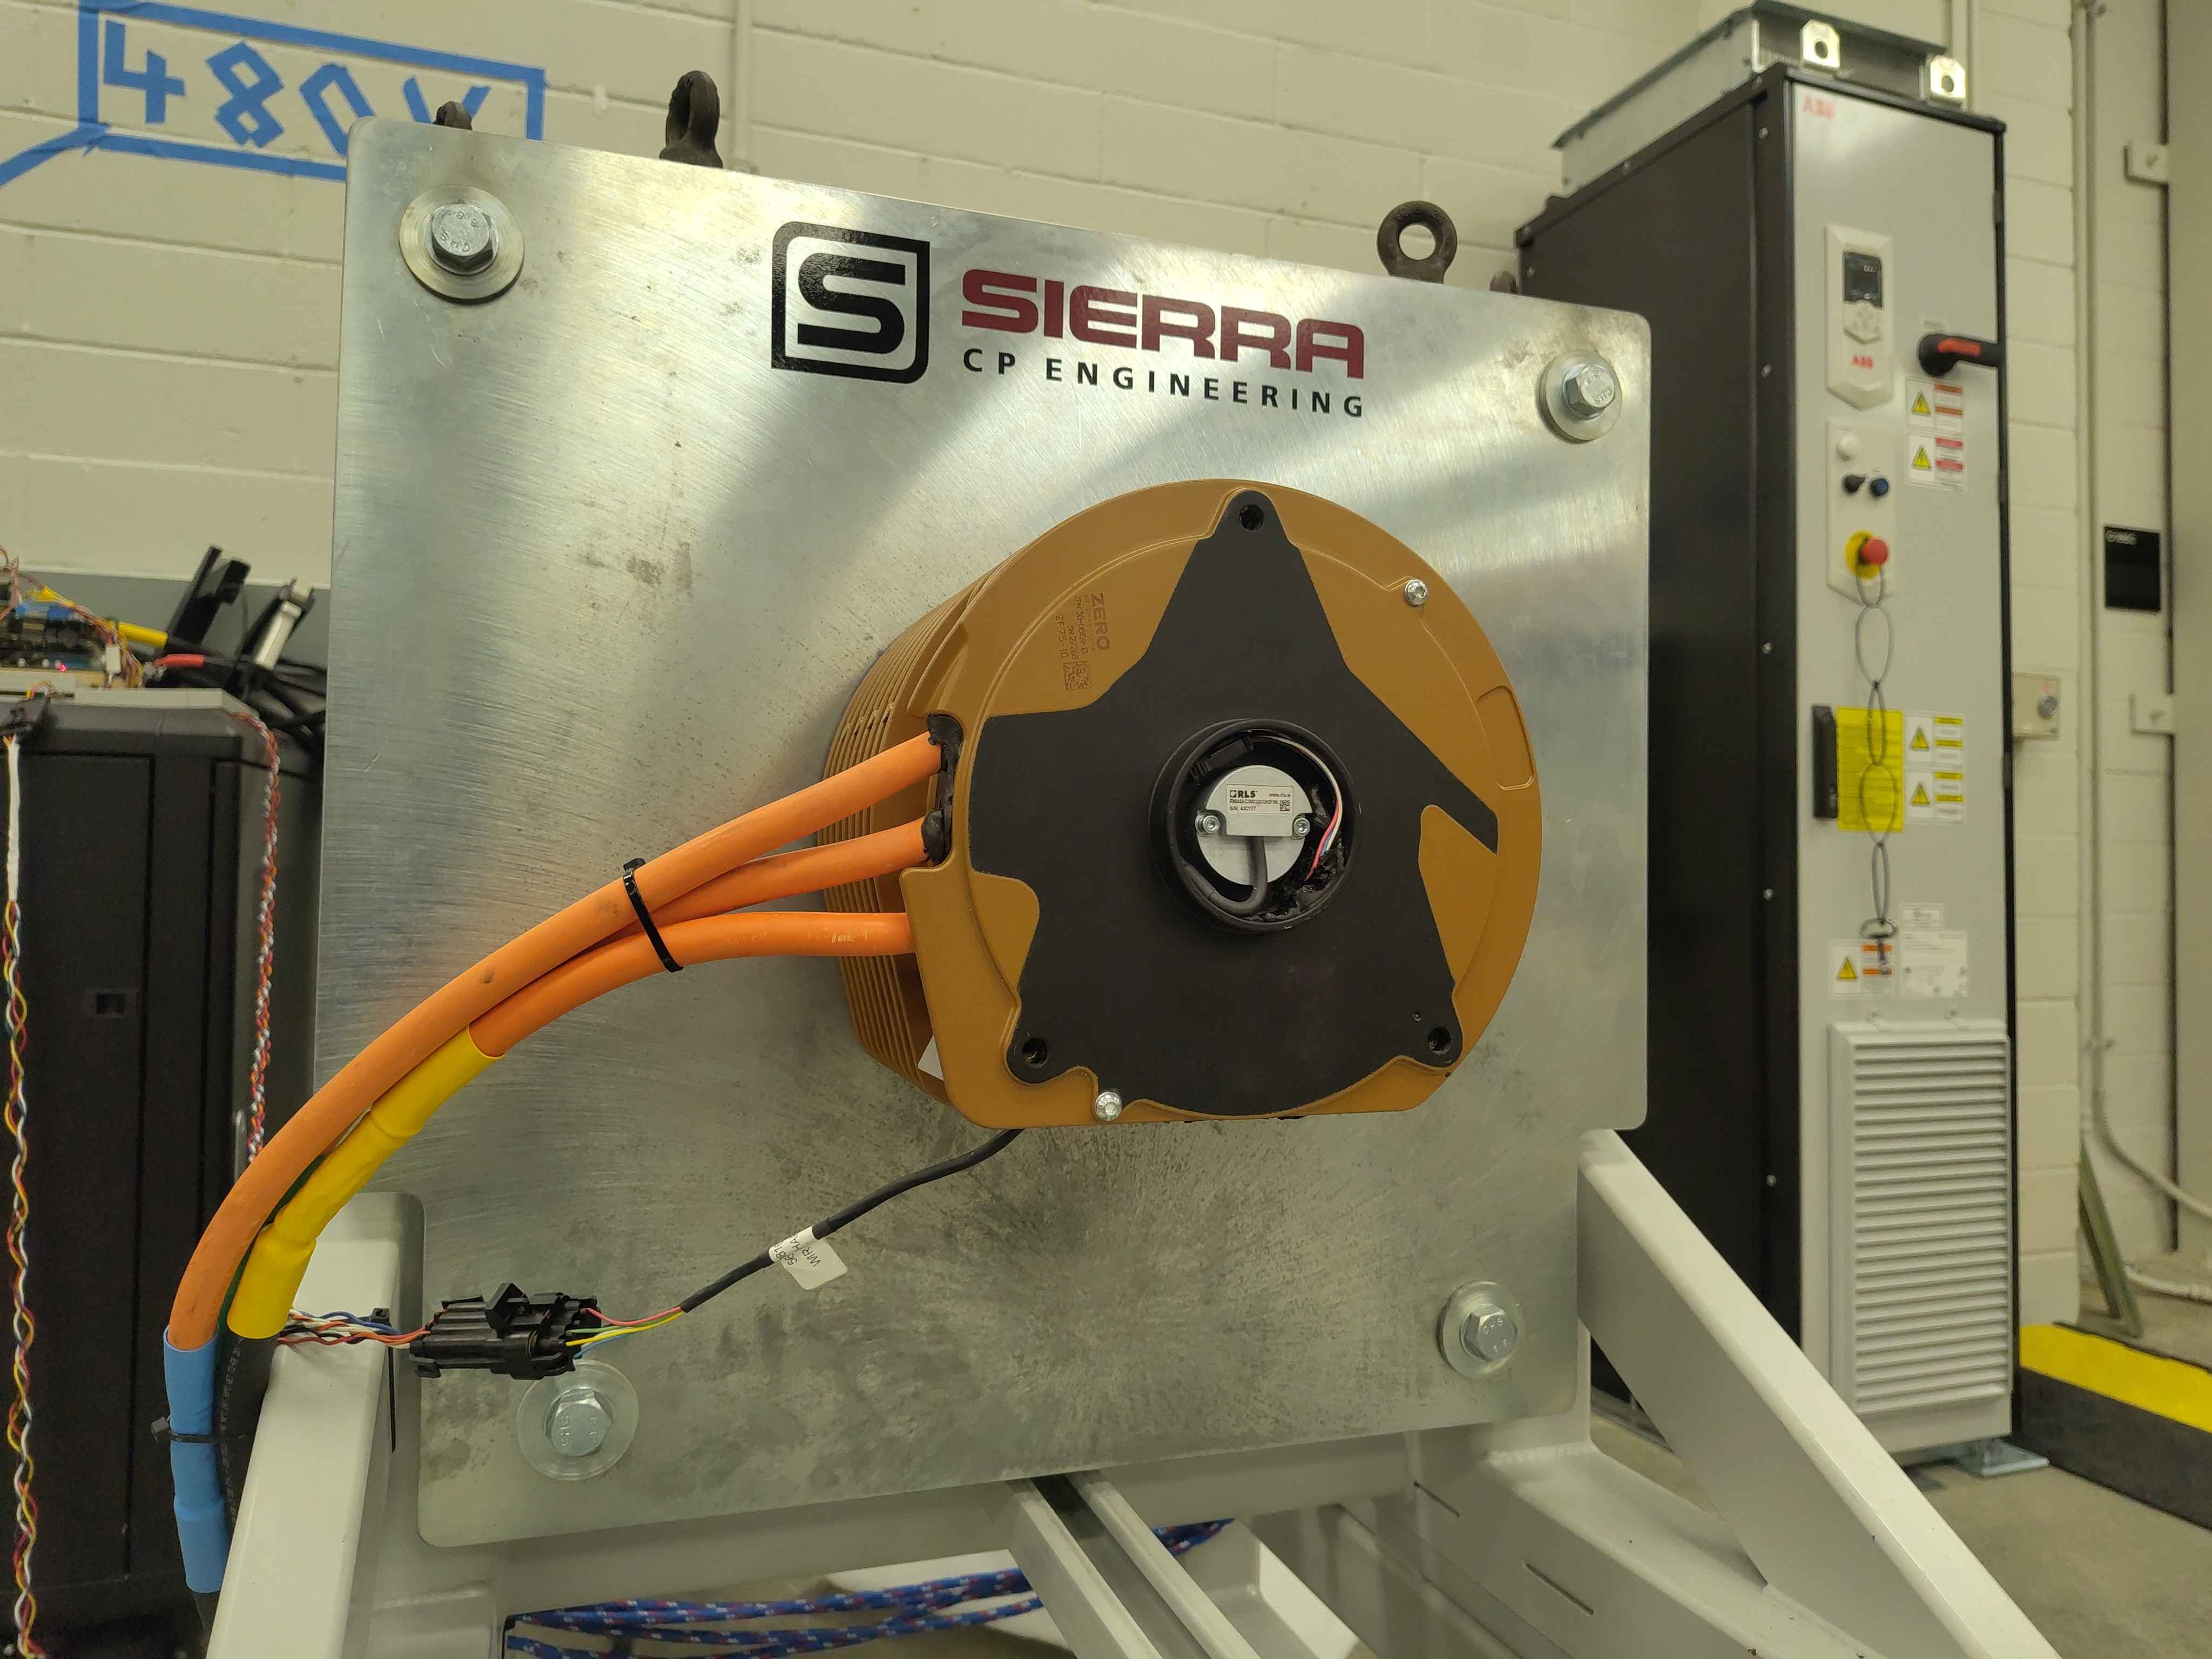
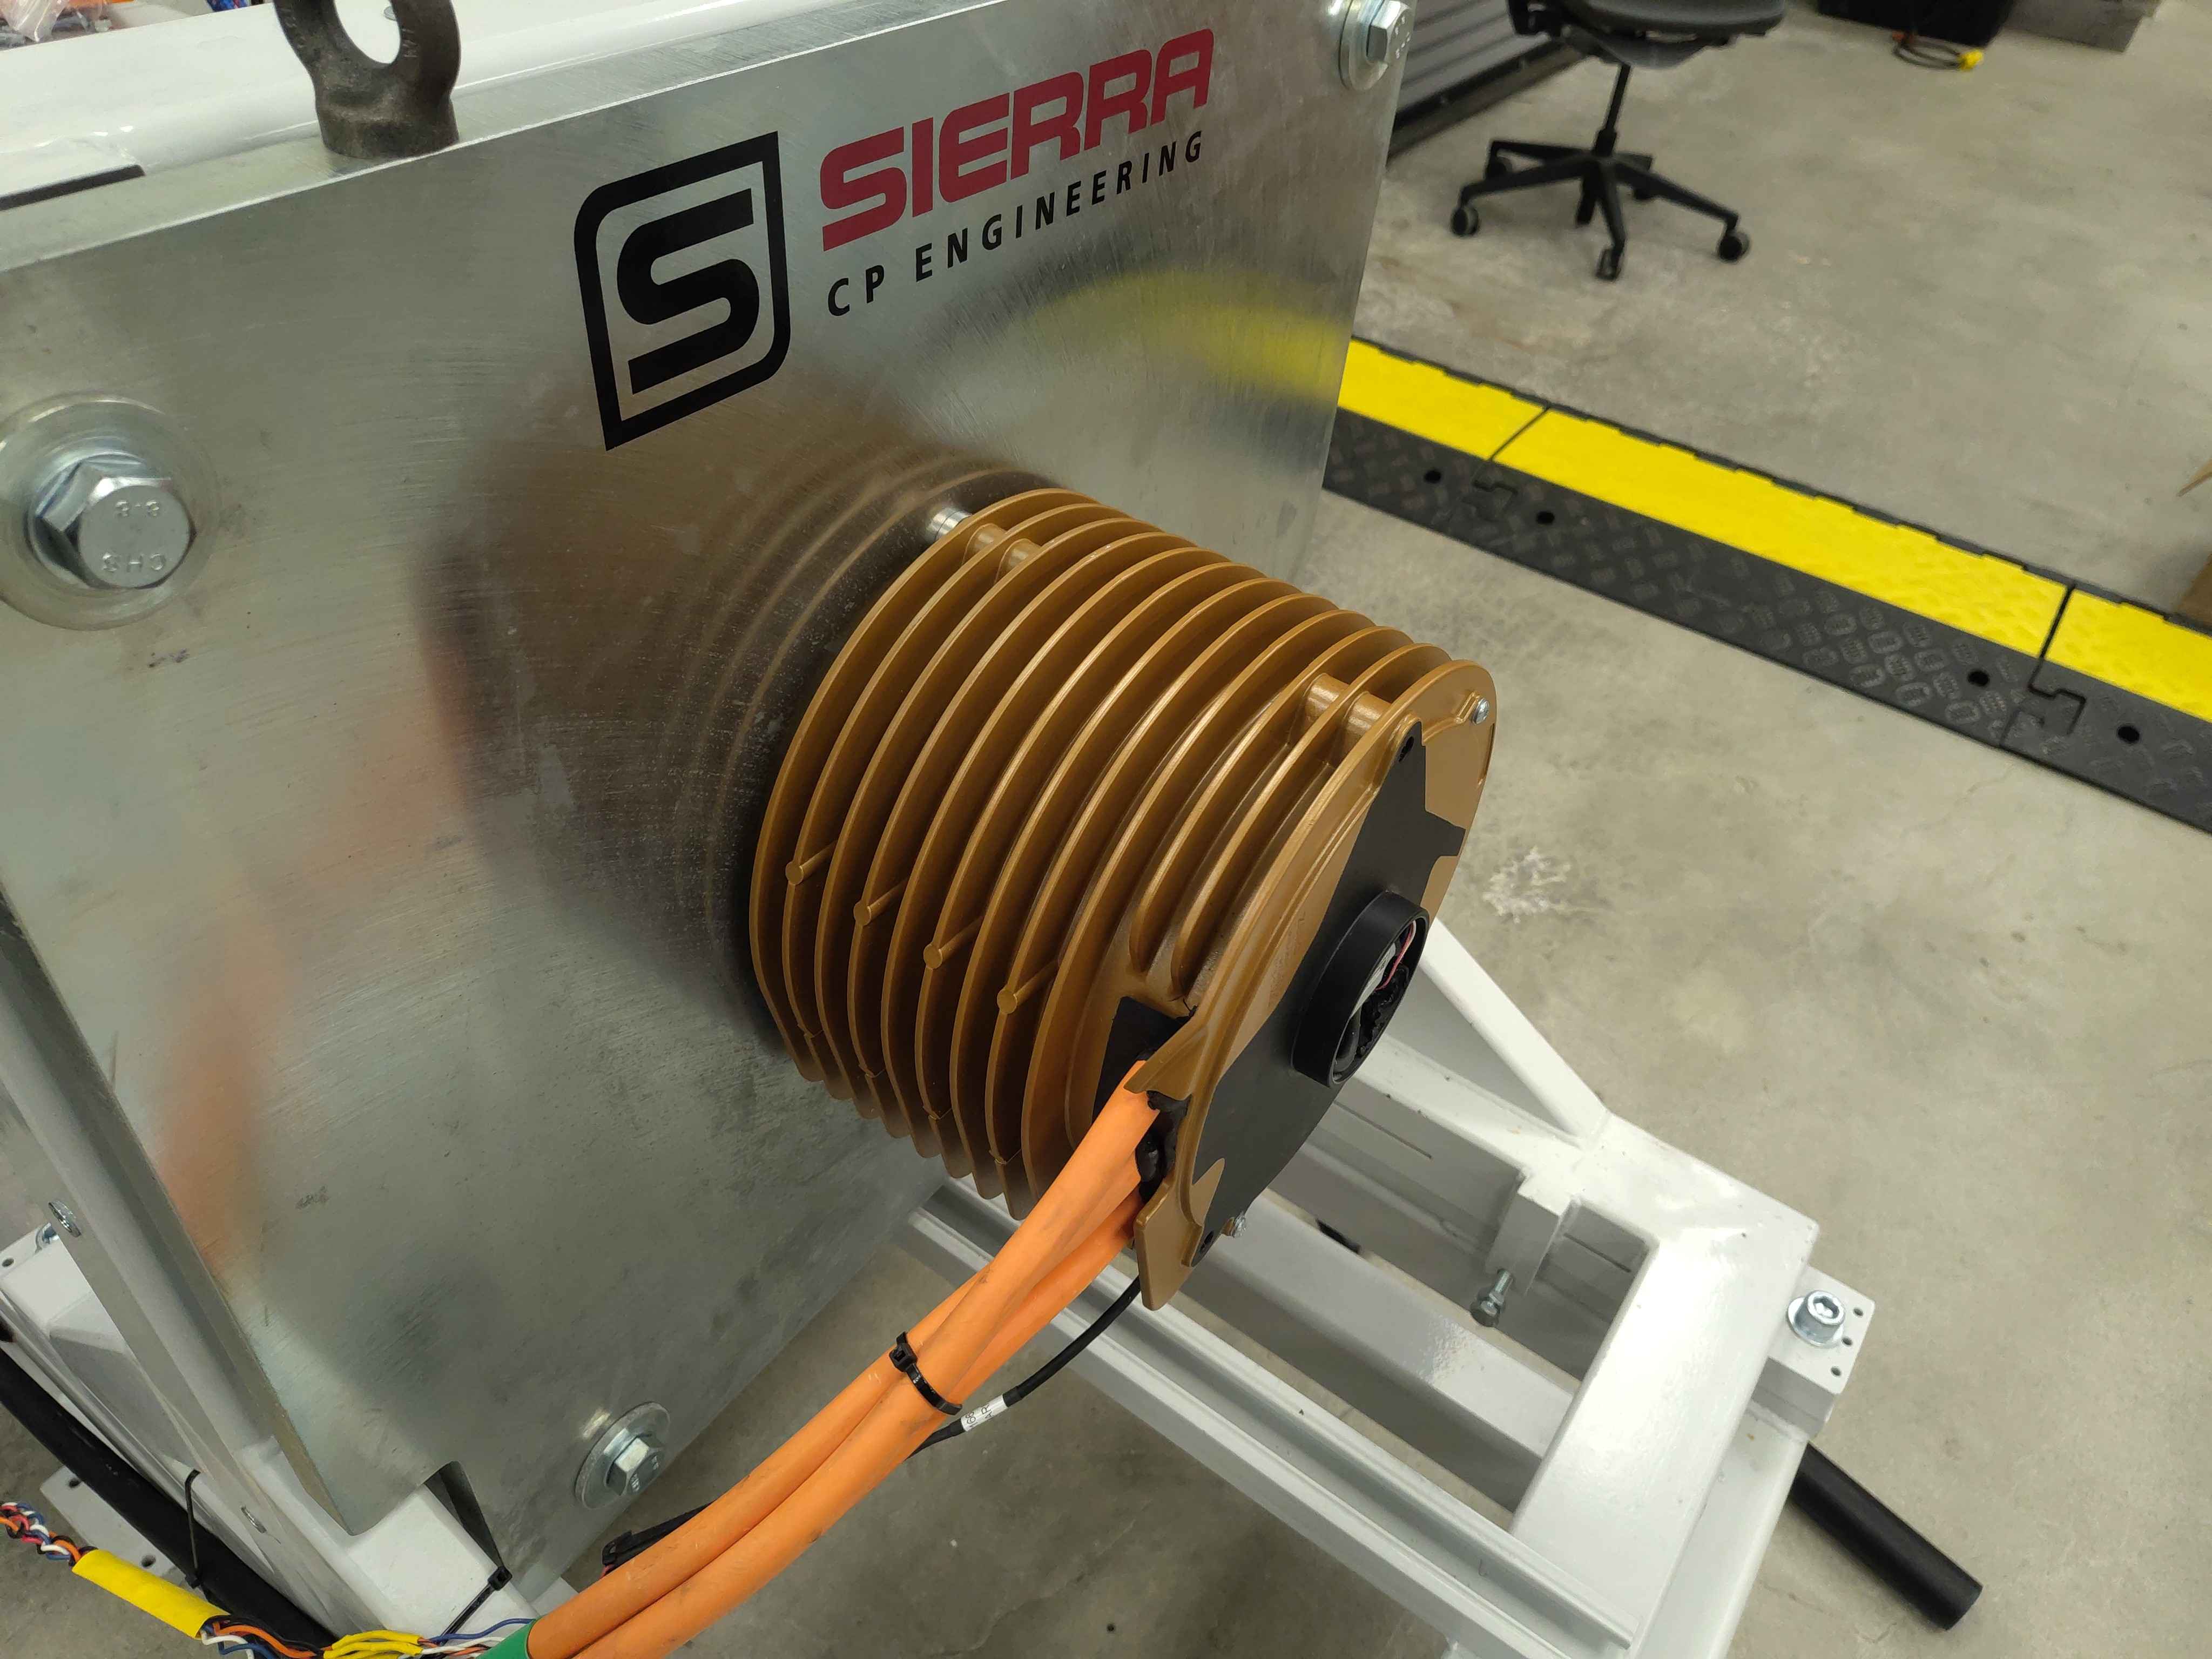
The motor is mounted on the Sierra CP Engineering test fixture with phase leads accessible for direct LCR measurement.
Instrument
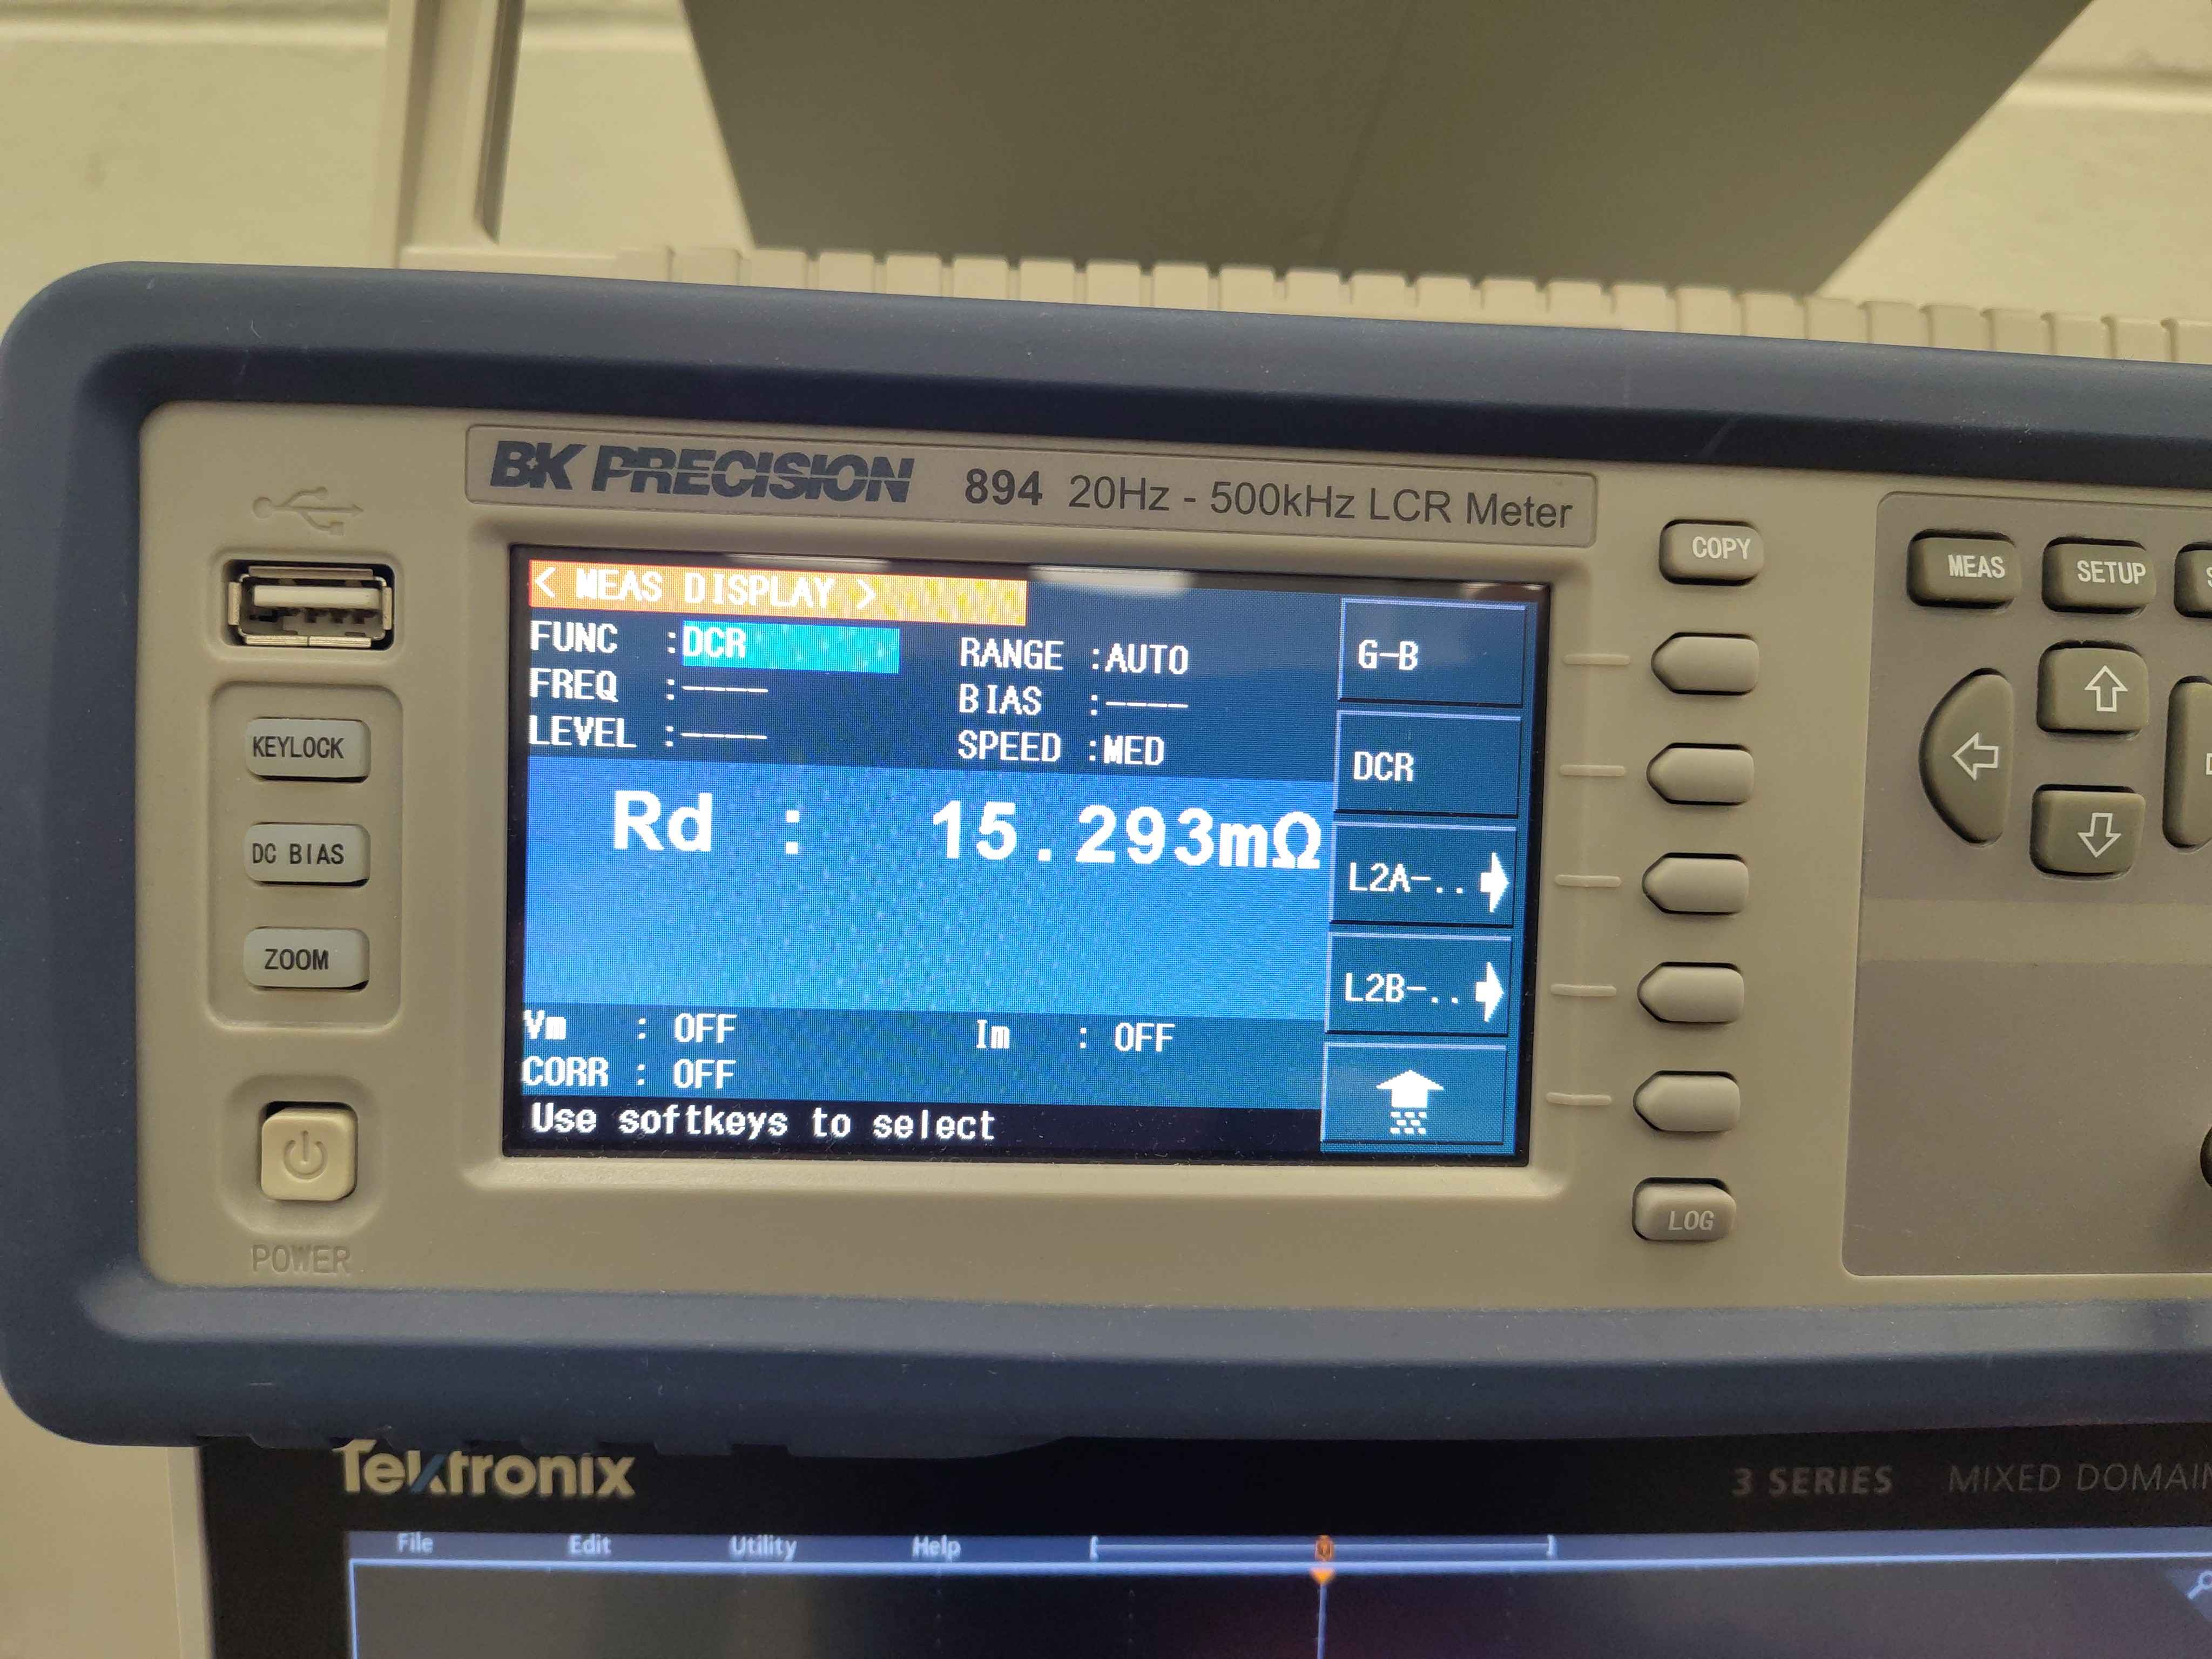
- Instrument: BK Precision 894 20 Hz - 500 kHz LCR Meter
- Function: DCR
- Range: AUTO
Measurements
Phase resistance (DCR)
| Parameter | Value | Instrument settings |
|---|---|---|
| Rd | 15.293 mΩ | FUNC: DCR, RANGE: AUTO, SPEED: MED |
Inverter-calibrated resistance
The inverter's cal Motor.Resistance routine was run to estimate the motor resistance and compare it against the LCR reference. Two runs were made at different DC-link voltages to check consistency.
Summary
| Run | Vdc | UV Rll | UW Rll | VW Rll | Average Rll | Per-phase (avg) |
|---|---|---|---|---|---|---|
| 1 | ~50 V | 15.2301 mΩ | 15.5424 mΩ | 15.6386 mΩ | 15.4704 mΩ | 7.7352 mΩ |
| 2 | ~120 V | 13.5548 mΩ | 13.7229 mΩ | 15.6423 mΩ | 14.3067 mΩ | 7.1534 mΩ |
| LCR reference | - | - | - | - | 15.293 mΩ | 7.6465 mΩ |
- Run 1 at ~50 V is within +1.2 % of the LCR reference (15.4704 mΩ vs 15.293 mΩ).
- Run 2 at ~120 V reads lower on UV and UW, pulling the average -6.5 % below the LCR reference. The VW pair is consistent with run 1 and the reference.
- The raw command log is available: Resistance-Command-Log.txt.
Calibration graph
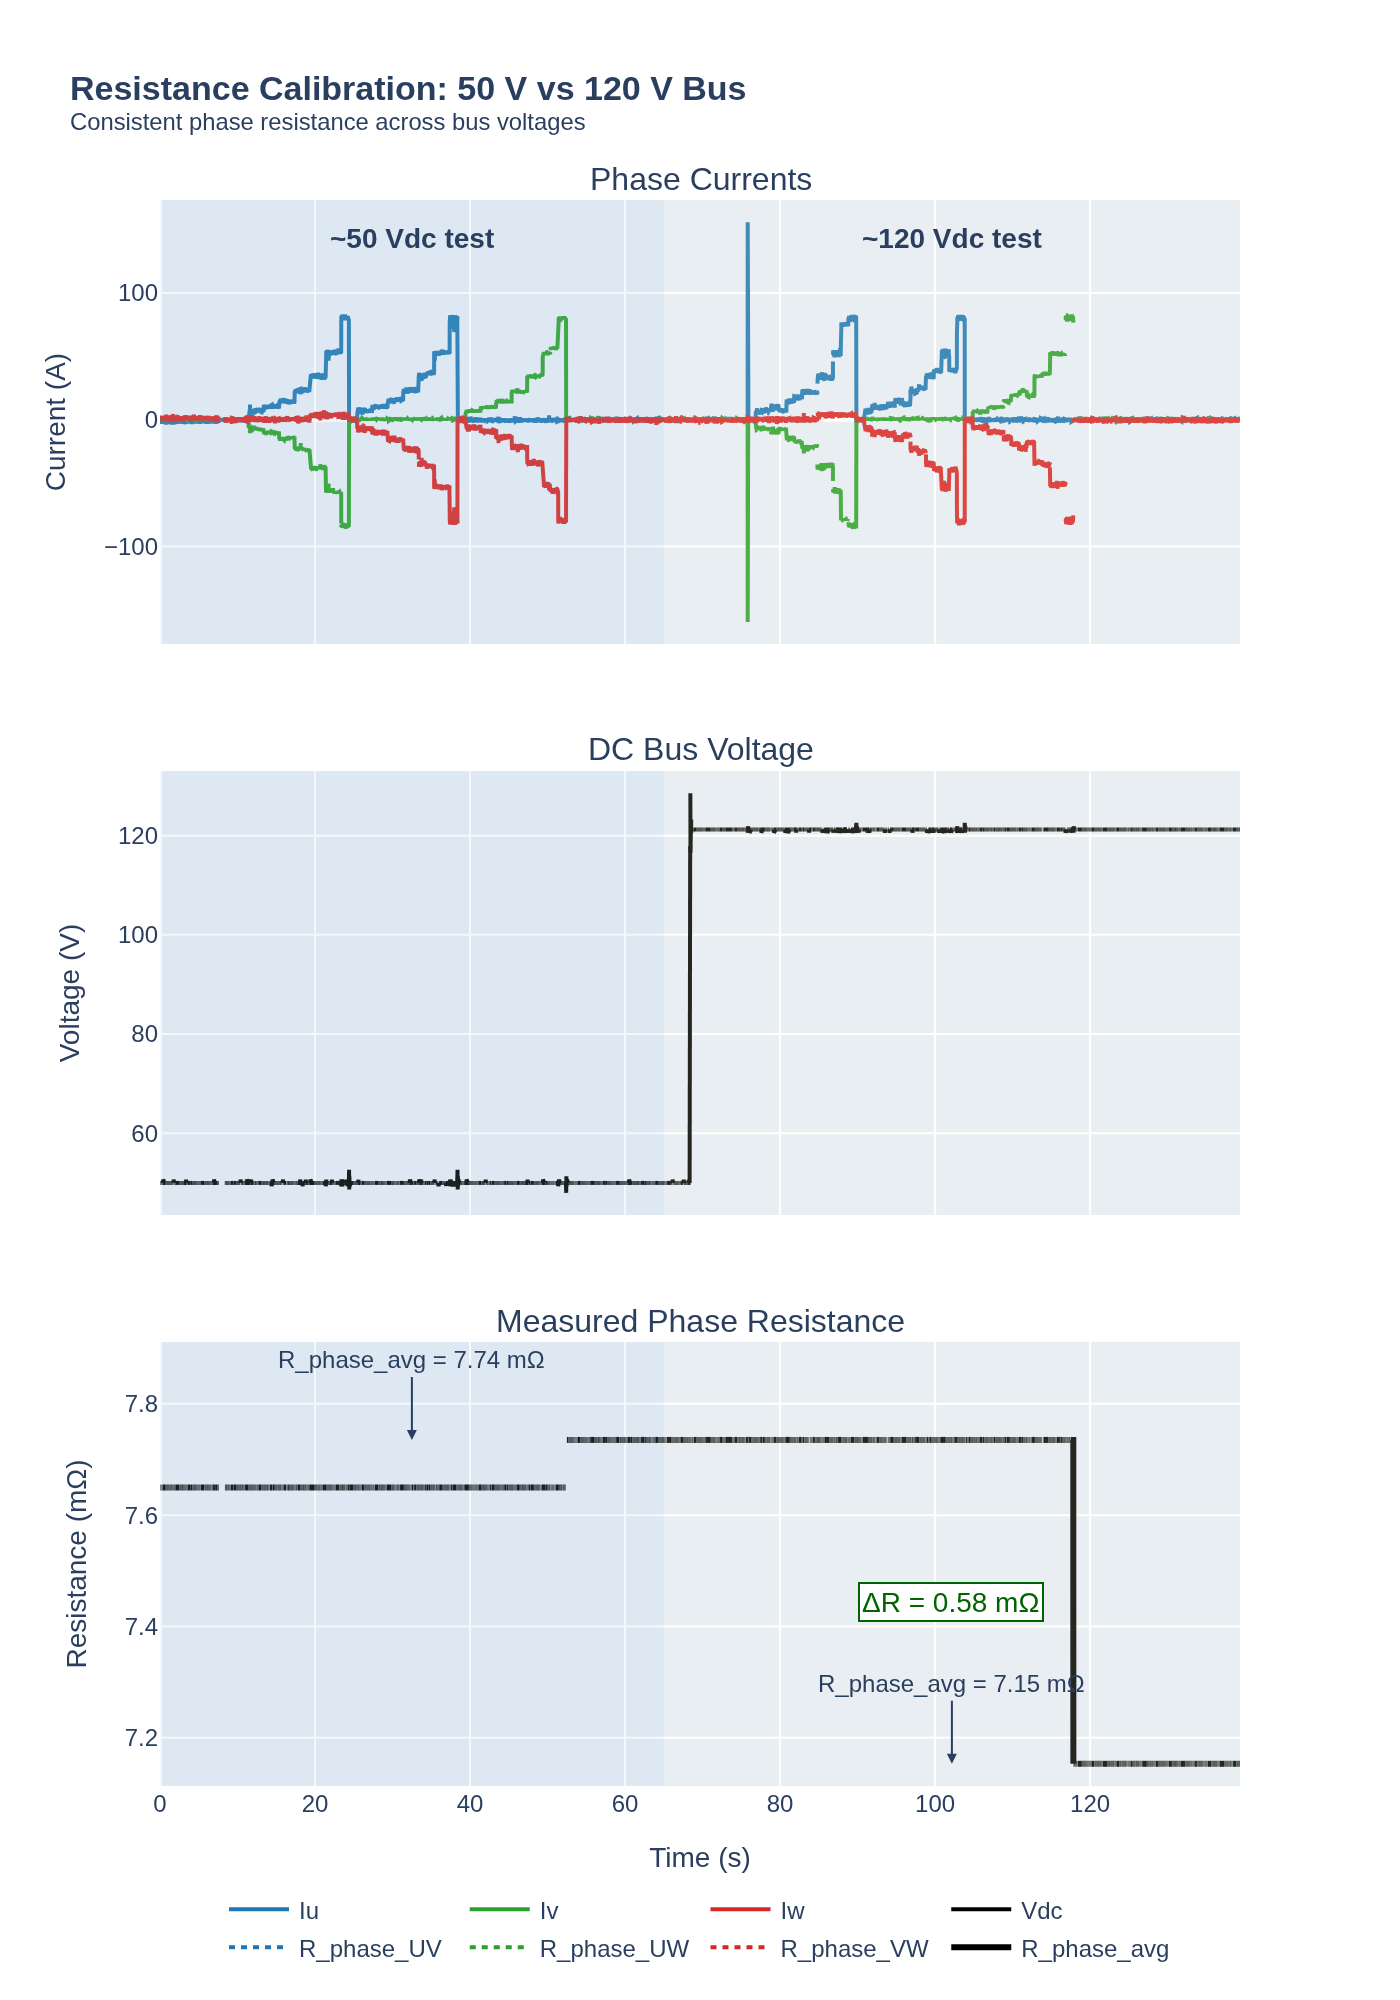
The plot below shows phase currents, DC bus voltage, and the per-phase resistance estimate for both bus voltages.
Open telemetry log: View this calibration in the Telemetry Viewer
From the plotted telemetry:
- 50 V run: R_phase_avg = 7.74 mΩ
- 120 V run: R_phase_avg = 7.15 mΩ
- ΔR between runs: 0.58 mΩ
Observations
- The 50 V result (7.74 mΩ average phase) is within +1.2 % of the LCR reference (7.6465 mΩ per phase).
- The 120 V result reads lower by -6.5 %. The per-phase traces in the plot are stable and consistent with each other, so the shift appears to be a systematic offset between the two runs rather than a noisy measurement.
- Possible causes for the 120 V offset:
- current-sensor offset or scaling drift at the higher DC-link voltage,
- connection/cable resistance differences between setups,
- temperature or settling differences between runs.
- The raw telemetry log is available for further analysis: ResistanceCalResult.jsonl - open in Telemetry Viewer.
Notes
- The DCR reading is the DC resistance measured directly by the meter.
- The line-to-line resistance is twice the per-phase value reported by the calibration routine.